Measured Moves in Trading
Measured moves are predictive techniques traders use to estimate how far a price move may extend based on previous price action.
Measured Move Tools
Fibonacci Retracements
→ Identify potential pullback levels within a trend.Fibonacci Extensions
→ Project future price targets based on previous swings.Quadrants Tool
→ Divide a move into equal sections for precise target setting.
Types of Measured Moves
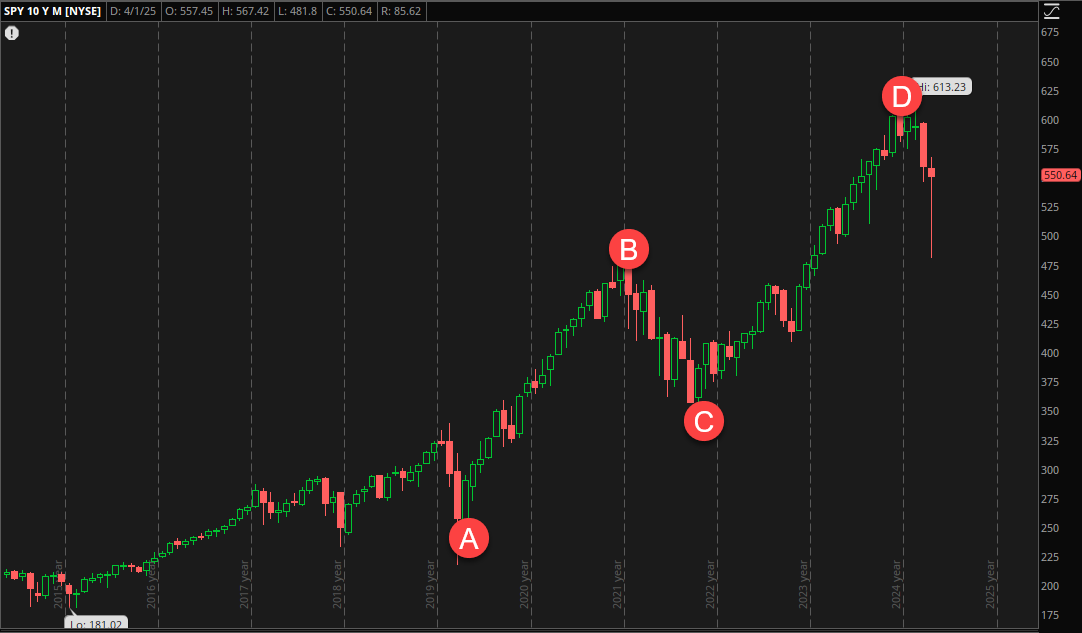
1. ABC Pattern
- A simple three-leg movement:
- A → B: First move.
- B → C: Retracement.
- C → D (Projected Move): Expected move similar to A → B.
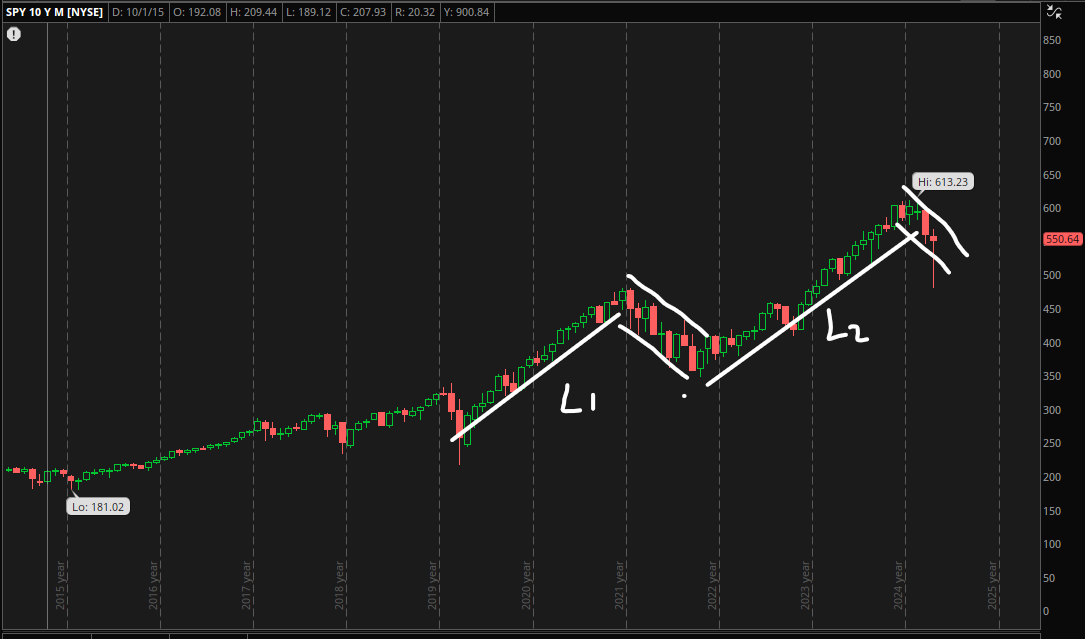
2. Leg 1 = Leg 2 (Symmetrical Move)
- The second leg of a trend is often equal in length to the first leg.
- Common in strong, trending markets.
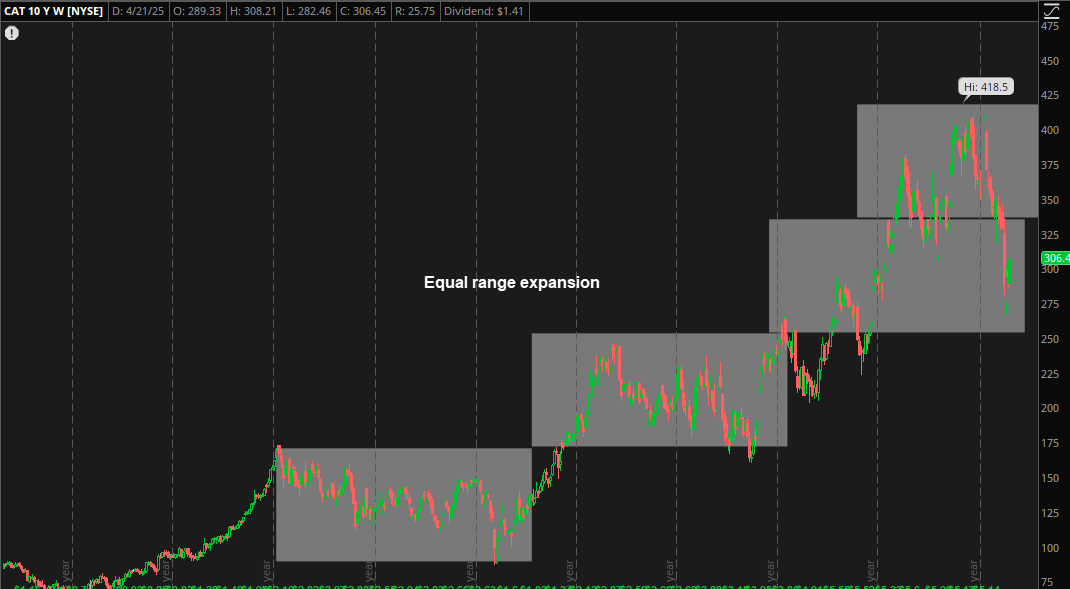
3. Height of Trading Range
- Measure the vertical distance between the top and bottom of a consolidation range.
- Project that distance upward or downward after a breakout.
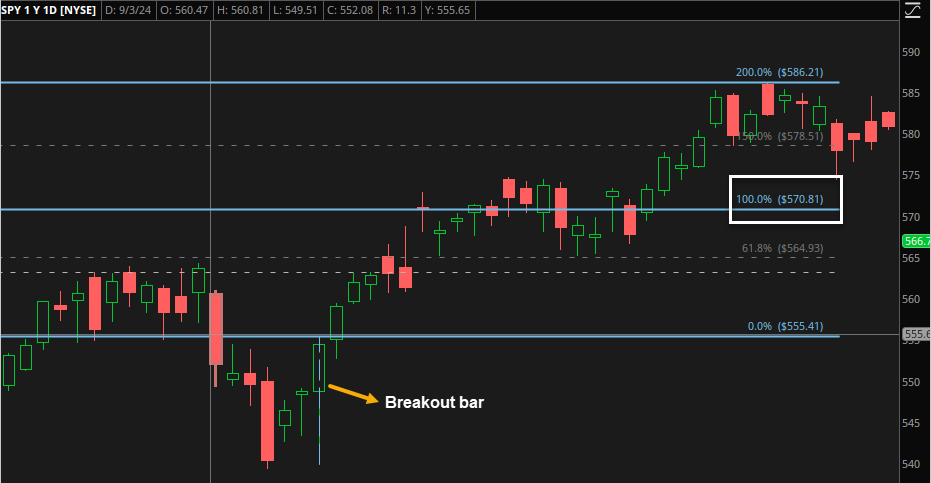
4. Height of Breakout
Breakout Bar + Follow-through Bar
- Strong breakout confirmed with immediate follow-through.
- → Expect a measured move in the direction of the breakout.
Breakout Bar + No Follow-through
- Breakout fails, market reverses quickly.
- → Expect a measured move in the opposite direction.
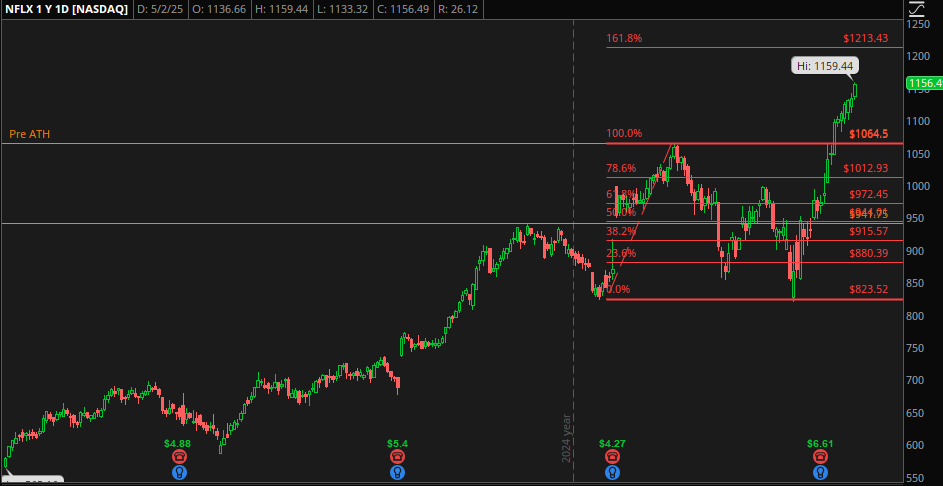
5. All-Time High Measured Move
- When a market breaks into new all-time highs, traditional resistance is absent.
- Traders often project measured moves based on:
- Previous major legs.
- Fibonacci extensions of earlier moves.
- Psychological round numbers.
Quick Summary
Measured moves give you logical price targets instead of guessing — crucial for planning entries, exits, and stop losses like a pro.
This post is licensed under CC BY 4.0 by the author.